Testing site performance used to feel like rocket science, but learning how to test website speed is actually straightforward once you know where to look. Website performance forms the foundation of every successful online project in modern web development.
Key Takeaways
- Site speed impacts search engine rankings, bounce rates, and user conversion metrics directly.
- Core Web Vitals like LCP, INP, and CLS define modern web performance standards.
- Test from multiple server locations and mobile network configurations for true accuracy.
- Waterfall charts reveal major bottlenecks like render-blocking scripts and server delay.
- Regular testing helps catch performance regressions before they hurt overall business results.
Why Fast Loading Speeds Keep Digital Products Alive
User Retention and Engagement
Visitors expect web pages to load almost instantly on any modern mobile device. When a page takes more than three seconds to load, over half of your visitors will leave before seeing your content. Fast-loading sites keep users engaged, reduce bounce rates, and build trust from the very first click.
Search Engine Optimization Impact
Google considers page speed a direct ranking factor for both desktop and mobile search results. Search engines prioritize websites that deliver fast, seamless user experiences over sluggish competitors. Measuring performance regularly ensures your technical SEO foundation remains strong and competitive.
Conversion Rates and Revenue Growth
Every second of delay directly reduces your conversion rates and hurts your overall revenue numbers. E-commerce platforms and business sites lose money every year due to slow checkout processes and laggy interfaces. Speed optimization directly drives business growth by making user actions totally effortless.
Essential Metrics Every Developer Must Track
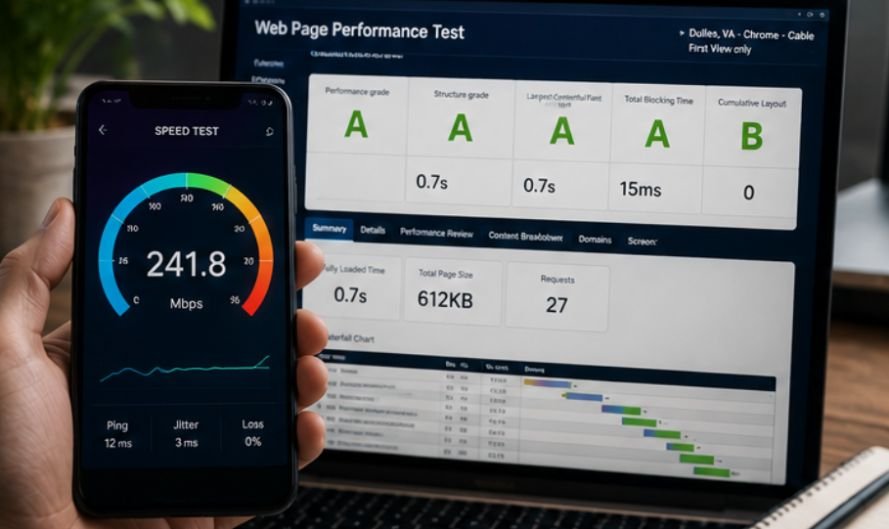
Understanding performance metrics helps you diagnose exact technical issues rather than guessing blindly.
Decoding Core Web Vitals
Google uses three main metrics called Core Web Vitals to measure real-world user experience accurately. Largest Contentful Paint measures how long it takes for the main content to render on screen. Interaction to Next Paint tracks overall responsiveness, while Cumulative Layout Shift evaluates visual page stability.
Lab Data Versus Field Data
Lab data comes from controlled environments designed to simulate specific devices and network speeds. Field data captures real performance from actual human visitors navigating your site over time. Combining both data types gives you a complete picture of your site health.
Understanding Server Response Time
Time to First Byte measures how quickly a web server responds to an incoming user request. A slow response time usually indicates poor web hosting, unoptimized database queries, or missing server-side caching. Fixing server delays improves every downstream metric across your entire website.
How to Test Website Speed with Top Diagnostics

Selecting the right diagnostic tools makes performance testing fast, accurate, and actionable for developers.
Google PageSpeed Insights
Google PageSpeed Insights provides immediate access to both real-world field data and controlled lab tests. It yields an overall performance score alongside clear, prioritized suggestions for speed improvement. Developers rely on this free tool because it aligns directly with search ranking criteria.
GTmetrix and Waterfall Analysis
GTmetrix combines performance testing with detailed waterfall charts to display every loading file cleanly. You can test from various global test locations to simulate global user bases accurately. Analyzing request timelines helps isolate oversized image assets, third-party scripts, and slow network calls.
Pingdom for Simple Regional Tests
Pingdom is a fantastic option when you need quick, straightforward performance reports without unnecessary complexity. It tests page load times, total page weight, and HTTP requests from multiple regions worldwide. The platform assigns clean letter grades, making rapid post-deployment checks easy for engineers.
How to Test Website Speed: Step by Step
Running speed tests correctly requires a clear systematic methodology to capture actionable data every time.
You can check your website speed using free online tools such as Google PageSpeed Insights, GTmetrix, or Pingdom. Simply go to one of these websites, type or paste your page link into the search box, and click the analyze or start button to see your performance report. Run tests multiple times throughout the day to account for temporary server load variations.
Examine the request breakdown to identify large media assets, render-blocking scripts, or slow database responses. Compare your mobile performance results against desktop figures, taking note of specific metric failures like high LCP or poor INP scores. Document your baseline numbers before making code modifications so you can measure optimization gains over time.
For official technical documentation on performance standards, consult web.dev Performance Guidelines and review developer notes on Google Search Central.
Fixing Common Bottlenecks to Turbocharge Load Times
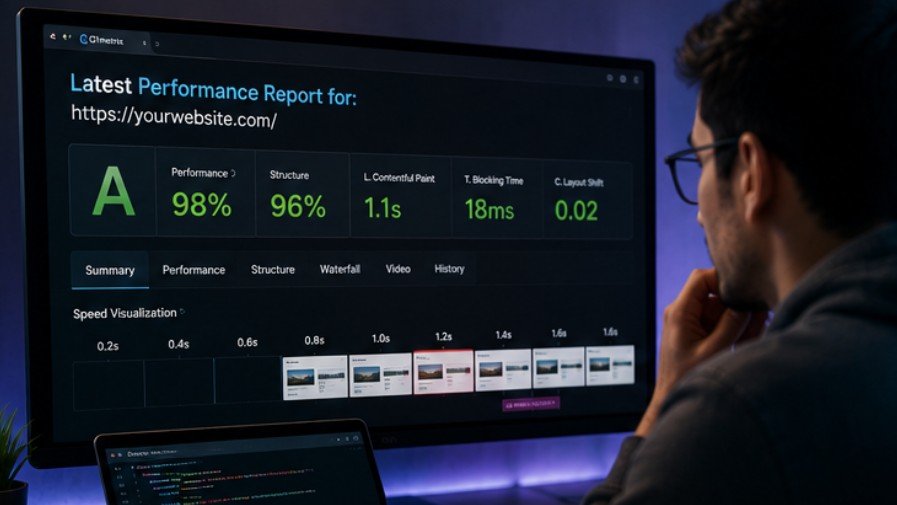
Most slow websites suffer from a few predictable technical issues that are straightforward to resolve.
Optimizing Oversized Media Assets
Uncompressed images and raw video files represent the single largest cause of page bloat today. Switching to modern image formats like WebP or AVIF drastically reduces payload sizes without losing quality. Implementing responsive images ensures mobile users download smaller versions tailored to their screen resolution.
Managing Render Blocking Resources
JavaScript files and external CSS stylesheets often pause page rendering while downloading in the browser background. Deferring non-essential scripts and inlining critical CSS allows the main page structure to display immediately. This approach improves perceived performance and lowers Largest Contentful Paint times significantly.
JavaScript performance also depends on how efficiently user interactions are handled after the page loads. Understanding what is event bubbling JavaScript can help developers reduce unnecessary event listeners through delegation, simplify interaction logic, and improve responsiveness across complex interfaces with many clickable elements.
Implementing Caching and CDNs
Browser caching stores static assets locally on user devices so returning visitors load pages instantly. Content Delivery Networks distribute your site assets across global servers, serving files from nodes closest to each user. Combining proper caching policies with a robust CDN drastically minimizes latency worldwide.
Performance tuning should also account for response configuration at the server level. Reviewing the best HTTP security headers for websites helps developers strengthen browser protections while ensuring headers, caching rules, and delivery settings are configured carefully without creating unnecessary conflicts or resource-loading problems.
Frequently Asked Questions
1. How to test website speed accurately across devices?
To learn how to test website speed across devices, run Google PageSpeed Insights or GTmetrix, selecting specific mobile and desktop profiles to compare lab and field metrics across different screen sizes and CPU throttle levels.
2. What is a good overall website performance score?
Aim for a performance score of 90 or higher on Google PageSpeed Insights, with sub-2.5-second Largest Contentful Paint load times and an Interaction to Next Paint under 200 milliseconds on mobile networks.
3. Why does my site speed score fluctuate between tests?
Scores vary due to fluctuating network traffic, third-party script delays, server responsiveness changes, and dynamic advertising scripts loading asynchronously during testing runs.
4. Does web hosting affect my page loading speed?
Yes, your web hosting provider directly impacts server response time, database speed, hardware capabilities, and resource allocation under heavy user traffic conditions.
Speed Up or Get Left Behind in the SERPs
Mastering how to test website speed empowers you to deliver exceptional digital experiences while boosting your organic search visibility. Regular diagnostic testing catches technical performance issues early, ensuring your web applications stay fast, lean, and user-friendly. Start auditing your pages today to optimize your load times and keep your users happy!